A report published in February 2017 by the National Housing Federation and Sitra ‘Strengthening the case for supported housing: the cost consequences’ highlighted in 2015/16 there was a shortfall of 16,692 places at a cost to the taxpayer of £361m in additional services and if current trends continue, the annual gap in provision will grow to 35,166 places by 2020/21.
So why aren’t all RPs investing more to bridge the gap?
We have taken a look at the financial performance of RPs operating with housing for older persons (HfOP) and highlight some key performance comparators below.
As expected there is a significant additional cost per unit for this type of provision although operational performance, debt per unit and liquidity reported is improved where larger portfolios are held.
However, the shortage of appropriate funding definitely means any provider who has a business objective to provide supported and housing for older people will find it challenging to deliver services. It may also continue to encourage providers to leave it to those who specialise more.
Recent Financial Performance Insights
Our performance review is based on data for providers in the financial year 2016 and split into three categories: >50%; between 20-40% and <10% of total stock invested in HfOP.
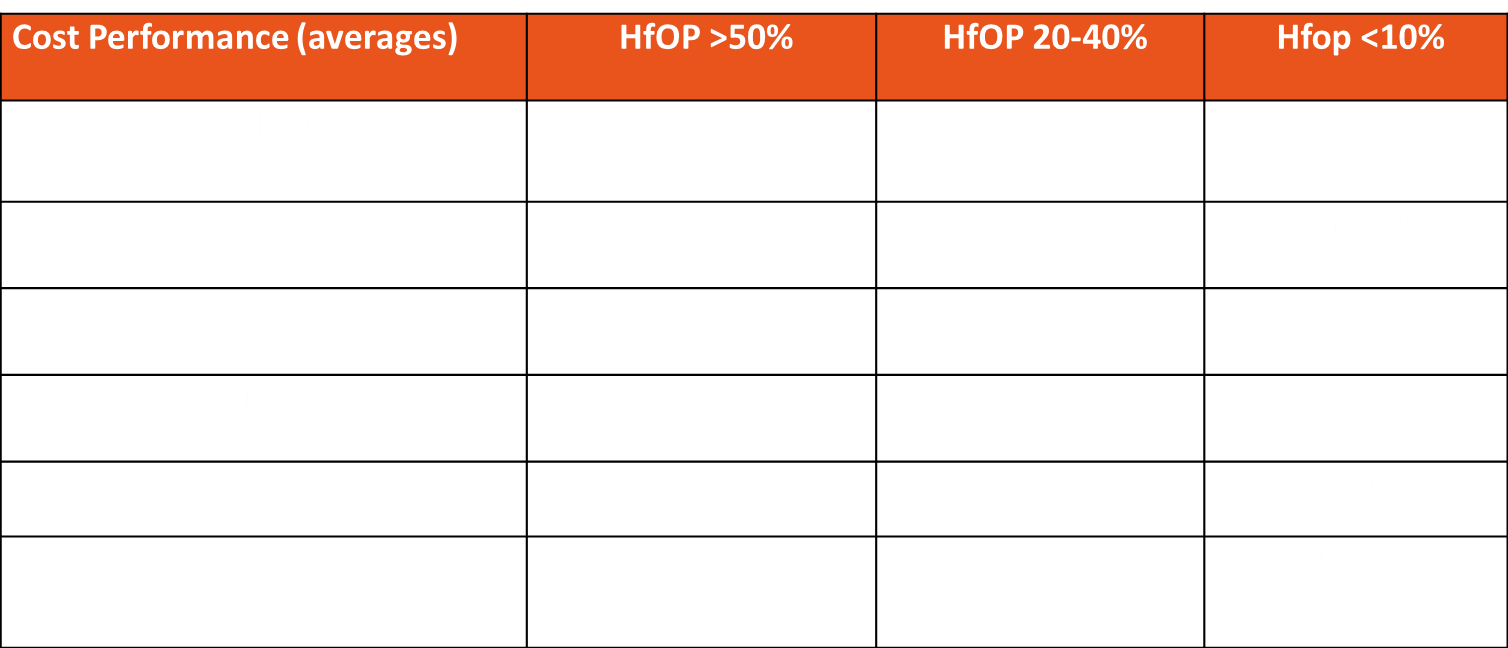
•RPs with predominantly HfOP stock have a higher cost per unit and significantly reduced operating margin.
•The levels of debt for higher HfOP stock is lower and liquidity better, indicative of lower levels of development of this type of stock.
• RPs with more HfOP stock have a significant higher average cost per unit. However, further analysis has shown that the average cost per unit for providers with above 50% of HfOP stock has reduced by 28% from FY 2015 to FY 2016.
• Bad debts for RPs with more HfOP stock are lower, however void losses are significantly higher.
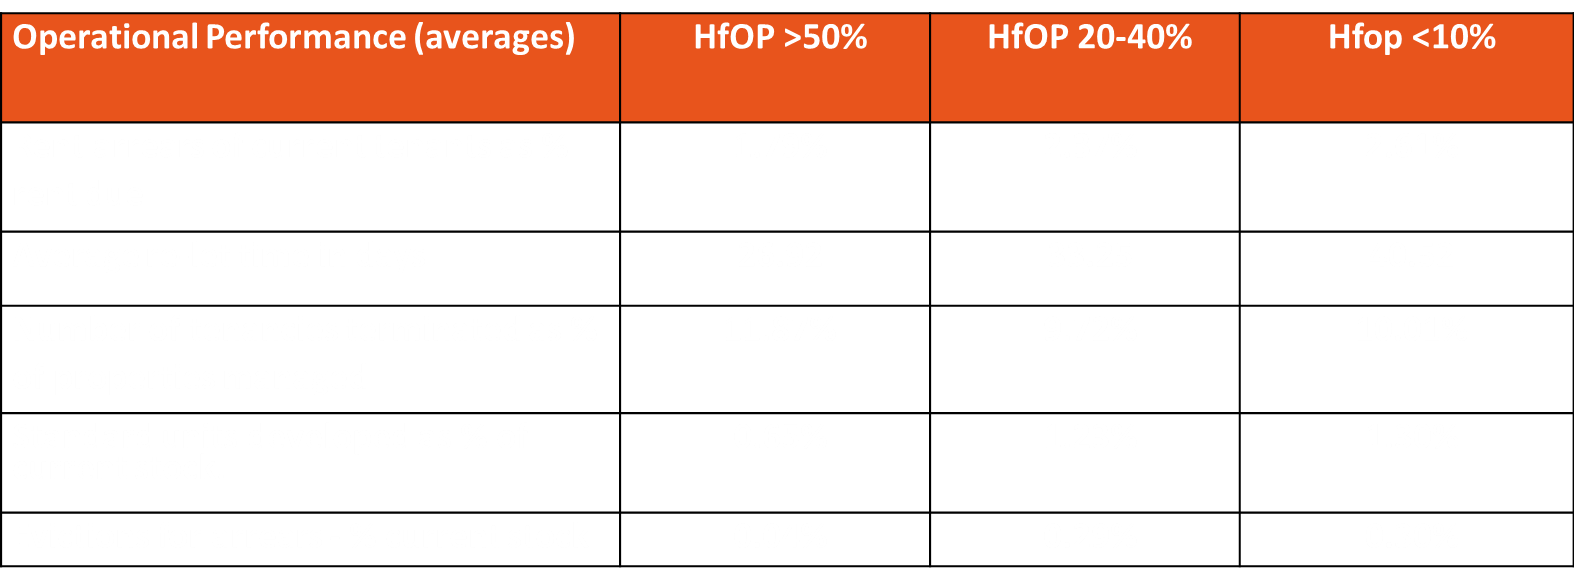
• Rent arrears, re-let times and evictions for providers of predominantly HfOP stock is better. However, there is a higher turnaround of HfOP stock and termination of tenancies.
Data Sources
□ Global Accounts FY 2016
□ I4H (Housing Performance Analytics) Database 11.8.17

Leave a Reply